TL;DR
- The opening race is your best chance to separate signal (repeatable pace, clear traits) from noise (Safety Cars, timing, one-off errors) before the season narrative hardens.
- Watch four things specifically: qualifying conversion, tyre degradation across stints, pit-loss reality, and where risk keeps showing up.
- Set a baseline before the race, then update your assumptions in layers afterwards — one class at a time.
- Run baseline vs adjusted scenarios in the Season Simulator and judge changes by whether they move the full distribution, not just the winner label.
The opening Grand Prix of a season is when most fans — and plenty of analysts — accidentally do the same thing. They treat one weekend as a verdict.
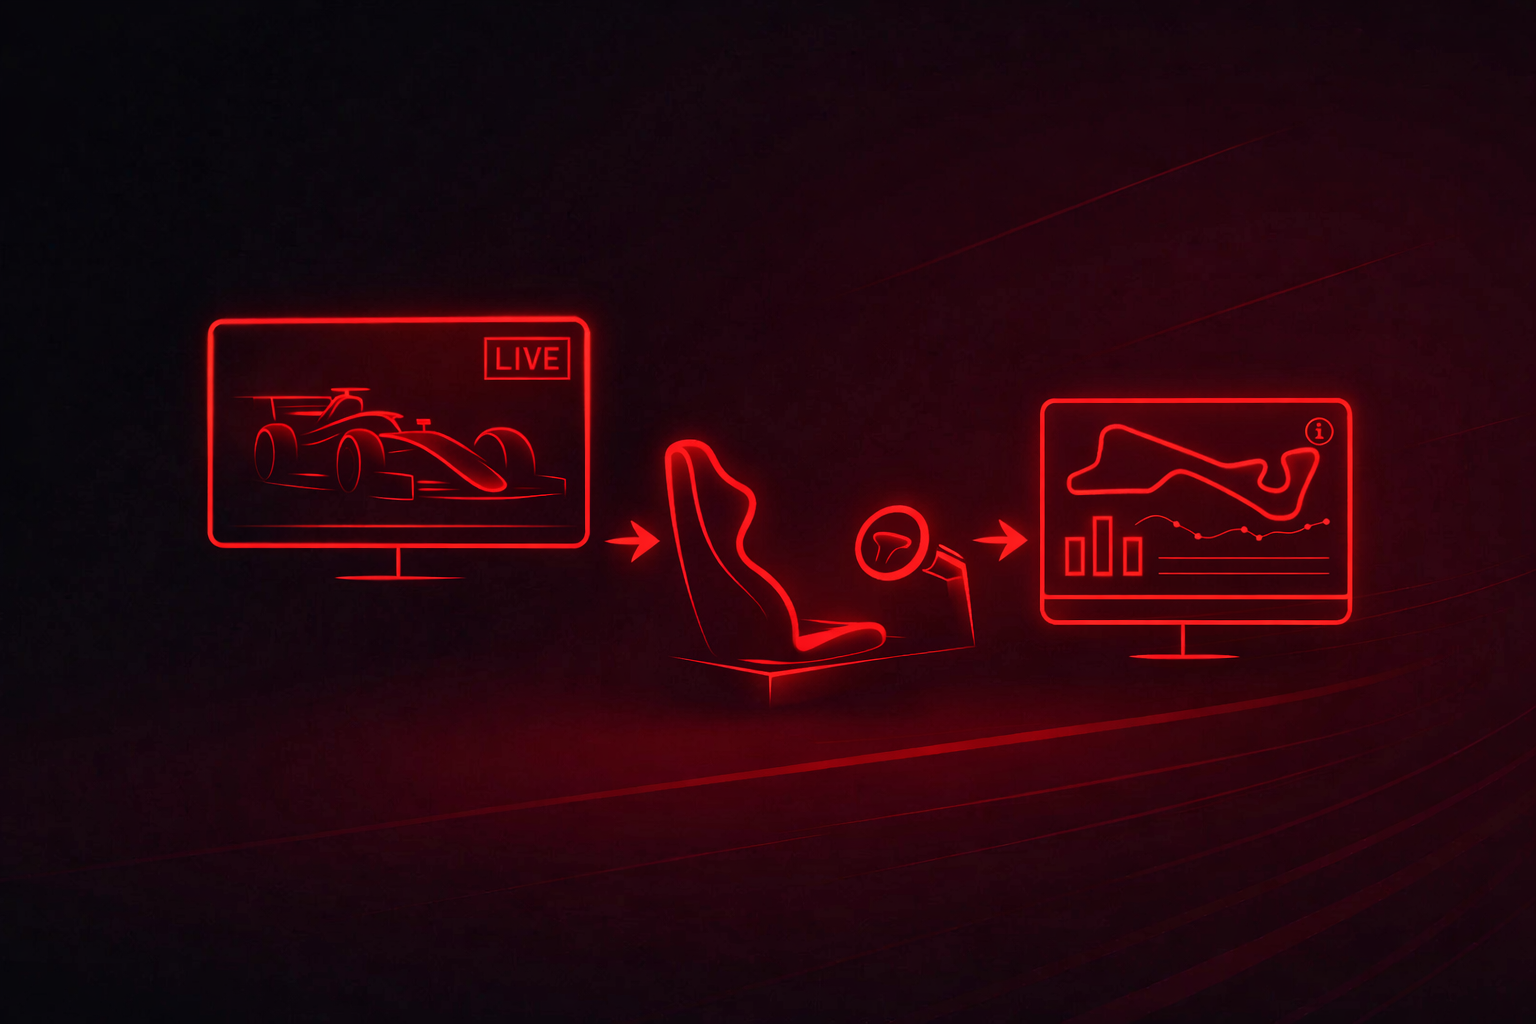
The smarter move is to treat it as a calibration lap for your model. An information-dense sample that updates what you think you know about pace, execution, and risk. Watch the first race with a simulator in mind and you’re not chasing a prediction. You’re running a repeatable workflow: observe, translate into assumptions, run scenarios, interpret ranges.
That’s what the Season Simulator is actually for — turning the first weekend’s evidence into structured “what if” outcomes you can stress-test through the rest of the calendar.
The mindset shift: you’re conditioning, not predicting
A season simulator isn’t a crystal ball. It’s a way to ask: if the world behaves like this — pace, reliability, penalties, variance — what standings are plausible?
The opening race is the first time your assumptions meet real multi-stint data, on a weekend when the teams are still learning their own cars. The goal isn’t “who’s fastest?” It’s “what changed relative to our prior beliefs, and how confident should we be?”
In simulator terms, you’re adjusting a handful of inputs that drive points distributions: baseline pace, tyre behaviour, overtake difficulty, pit-loss sensitivity, incident and penalty rates. None of them should move a lot after one race. Some of them should move a little.
One context note for 2025 onwards: no fastest-lap bonus. That removes a small but sometimes narrative-shaping point swing, and makes the simulator’s job a bit cleaner. Points are primarily position-based (plus sprint points where they apply), not a late-race tyre flyer for a bonus.
Before lights out — build a baseline you can beat
If you only run a simulator after the chequered flag, you’ll overfit the first race. Build a pre-race baseline first. Reasonable expectations based on last season’s form, winter testing impressions, and general team trajectories.
Do that baseline run in the Season Simulator with conservative assumptions. The point isn’t accuracy. It’s creating a reference point so that post-race changes carry meaning. When you later update the model, you can say exactly what moved — “this specific observation shifted the expected points by X” — instead of vaguely feeling that everything changed.
The baseline should avoid extreme certainty. Opening races are high variance: new packages, limited long-run confirmation, and the first real stress test of reliability and operational sharpness. A good baseline is one that can be wrong without being ridiculous.
Watching qualifying — pace is real, but context is everything
Qualifying is usually your cleanest single car-performance data point of the weekend, but only if you respect the context. Watch for gaps that repeat across sessions — Q1 to Q2 to Q3 — not a single headline lap. Watch who had to spend time or tyres to escape danger, versus who advanced comfortably. The final grid position can hide the underlying pace that repeated gaps reveal.
Translate that into simulator thinking. Qualifying changes the expected distribution of race outcomes because grid position influences tyre life, strategy options, and exposure to incidents. But opening rounds can exaggerate qualifying gaps through setup misses, track evolution, or the traffic-and-flag timing that breaks evenly in a normal weekend and unevenly in a chaotic one.
The move after qualifying isn’t locking in a new hierarchy. It’s running two variants:
- Hold your baseline pace, treating qualifying as noisy.
- Partially update pace, treating qualifying as signal.
If your season picture only flips under the full update, you’re leaning too hard on a single session.
Watching race stints — degradation, not just lap time
Race pace isn’t a single number. It’s the relationship between pace and tyre life under fuel, traffic, and thermal conditions. When you watch the opening race, pay attention to how lap times fall away, not just the fastest lap on a clean track.
A driver who looks slow might be extending a stint without falling off a cliff. Another might look quick for eight laps and then hit a degradation wall that forces an early stop and hands away track position. Those are fundamentally different performance profiles, and they change strategy sensitivity for the rest of the season.
Degradation affects three things in simulator terms:
- How valuable qualifying is (track position is stickier or looser depending on deg).
- How punishing traffic is (following overheats tyres and accelerates wear).
- How much upside alternative strategies have (aggressive stints raise variance).
Update the assumptions in ranges, not absolutes. If Team A looked gentler on tyres, don’t encode “they always win long runs.” Encode “their downside risk on high-deg tracks is lower” and watch what happens to the points distribution. That’s a smaller claim, and it’s the one the data actually supports after one weekend.
Watching the pit lane — pit-loss and operational risk
The first race often exposes whether pit-loss (the time cost of a stop) behaves as expected for the circuit and season. Without a stopwatch, you can usually infer pit-loss from undercut and overcut behaviour — if fresh tyres plus clean air reliably leapfrog track position, pit-loss is low enough that early stops have teeth.
Pit lane also reveals operational sharpness. Messy releases. Slow wheel-guns. Unsafe releases. Penalty exposure. These aren’t drama — they’re inputs to your variance assumptions. A team that looked dominant in free practice and untidy in the pit lane across the weekend hasn’t yet proven it can cash in its pace.
Test two operational profiles in the Season Simulator for teams you’re uncertain about — one with “clean execution” variance, one with “messy weekend” variance. If a title story collapses only under the messy profile, the takeaway is conditional: the ceiling exists, but robustness is unproven.
Watching for incidents — the hidden points tax
The opening race can be chaotic or deceptively clean. Don’t treat a single DNF as destiny or a tidy finish as proof of reliability. Watch where risk appears.
- Are drivers collecting track-limits warnings or time penalties?
- Is a team repeatedly putting cars in recovery-prone positions — poor starts, bad first-lap placement, high-contact battles?
- Do reliability issues look like teething problems that’ll be fixed, or systemic weaknesses that won’t?
In a simulator, all of these are probabilities — of non-finishes, penalties, lost positions. Small probabilities that compound across 24 races into a meaningful points tax.
After the race, run a “clean season” and a “realistic mess” season. If the title narrative you’re drawn to only survives the clean version, that isn’t a prediction. It’s a conditional hope.
Post-race — update in layers, not in one pass
After the flag, the temptation is to rewrite your entire model. Don’t. Update in layers, each time asking: did this change my conclusion, or just my confidence?
Start by rerunning the baseline in the Season Simulator unchanged. Then apply one class of update at a time.
- Pace update (based on qualifying plus race stints): modest shifts, not absolute hierarchy flips.
- Degradation and strategy sensitivity update (based on stint behaviour): adjust how often alternative strategies beat the baseline plan.
- Execution and incident update (based on penalties, errors, risk exposure): widen or narrow variance.
The goal is interpretability. When the simulator output changes, you should know exactly which layer moved it. That’s how you build trust in your own decision-making instead of letting one Sunday drive a season’s worth of conclusions.
Reading the output without fooling yourself
A season simulator should give you distributions. Ranges of points. Probabilities across finishing positions. Sensitivity to assumptions. The most common first-race misread is treating an increased win probability as a guarantee.
A better way to read it after Race 1:
- If a driver’s title odds rise because your pace assumption moved, that’s meaningful — but fragile if the pace evidence is thin.
- If their odds rise because their downside risk shrank across multiple scenarios — clean race, messy race, high-deg, low-deg — that’s more robust.
Use the simulator to deliberately stress-test the story you want to believe. If it survives conservative inputs, it’s probably real. If it only survives best-case assumptions, the model is telling you to downgrade your certainty, even when the headlines say otherwise.
A workflow you can repeat all season
Watch the race like an observer, not a judge. Capture a few grounded notes: who had repeatable pace, who managed tyres, who executed cleanly, where risk kept showing up. Then use the Season Simulator as the bridge between “I saw this” and “here’s what it means for the standings.”
Opening weekend doesn’t decide the championship. It decides how fast you stop guessing. Run your baseline, apply measured updates, keep your conclusions conditional. If you do that from Race 1, you’re doing championship modelling, not reaction.
The takeaway
Open the Season Simulator, run a pre-race baseline for your top contenders, then rerun it after Sunday with only the updates you can defend. The difference between those two runs is the actual story of the season’s first weekend — not the race result, and definitely not the headlines.